Probability
The probability of an event happening is defined to be the number of ways in which the event can happen divided by the total number of possible outcomes. For example, a fair coin, which can never land on it's edge, has two possible outcomes, heads or tails. The number of ways in which you can get a head is one and the number of ways in which you can get a tail is one. Therefore, the probability of getting a head, $P(head)$, is $1/2$, which is the same as the probability of getting a tail.
Probabilities are given as a fraction or decimal number between $0$ and $1$. $0 \leq P(event) \leq 1$. $0$ means the event will not happen, $1$ means the event will happen. Everything between means the event may happen. Probabilities may also be expressed as percentages.
$P(head) = P(tail) = 1/2$ or $0.5$ or $50\%$
Definitions
Independent events are events that are not effected by other events. If you have a bag with 50 red balls and 50 blue balls that are all identical except for the colour then the probability of selecting a red ball is determined by the number of red and blue balls and nothing else.
Dependent events are events that can be effected by previous events. If you had taken a ball out of the bag and not replaced it then the probability of selecting a red ball has been changed by the first event.
Mutally exclusive events are events such that if one happens then the other cannot happen. If you toss a coin you will get heads or tails. If you get heads you cannot get tails. If you get tails you cannot get heads. The two outcomes are mutually exclusive.
Addition Rule
Imagine an experiment that involves tossing a coin 10 times. You could get 10 heads. You could get 10 tails. The the most likely outcome, though, is 5 heads and 5 tails. Imagine we got $n$ heads where $0 \leq n \leq 10$ then the probability of heads is given by $P(heads) = n/10$. The probability of tails is given by $P(tails) = 1 - n/10$
The probability of heads or tails is: $P(heads\ or\ tails)=P(heads)+P(tails)$.
.png)
In the previous example the events were mutually exclusive so there was no overlap of the regions in the Venn diagram. Imagine we are investigating possible links between long-haul flying and deep vein thromboses. Some people fly, some don't. Some get deep vein thromboses, some don't. Some people fly and get deep vein thromboses. We can show this on a Venn diagram.
2.png)
If we add $P(Fly)$ and $P(DVT)$ we will include the overlap, that is $P(Fly \cap DVT )$, twice so the probability of a person flying or getting a deep vein thrombosis is given by:
$P(A\ or\ B) = P(A \cup B) = P(A) + P(B) - P(A \cap B)$.
Multiplication Rule
In our experiment into flying and deep vein thromboses we are likely to be interersted in the set of people who fly and get deep vein thromboses, that is the region of intersection of the two sets. This group is given by:
$P(A\ and\ B) = P(A) \times P(B) = P(A \cap B)$.
Summary
$P(A\ or\ B) = P(A) + P(B) - P(A \cap B)$
Note: When $A$ and $B$ are mutually exclusive $P(A \cap B)=0$
$P(A\ and\ B) = P(A) \times P(B) = P(A \cap B)$
Tree Diagrams
Tree diagrams can be used to identify all the different possible outcomes. Imagine you want to know all the possible outcomes from tossing a fair coin three times. The tree diagram would look like this:
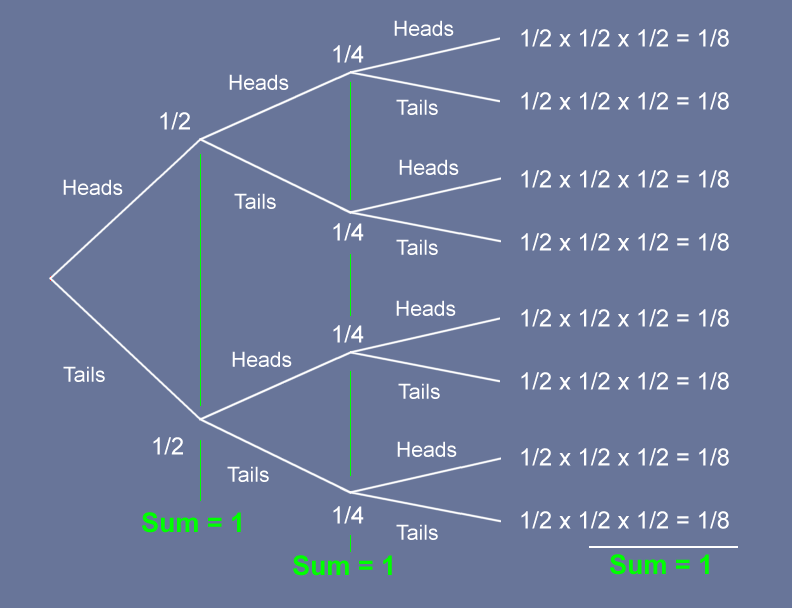
Notice the sum of the probabilities at each branch is equal to 1.
The chances of getting 3 heads is
$P(3\ heads) = 1/2 \times 1/2 \times 1/2 = 1/8$.
There are three ways in which you could get 2 heads so the probability of getting two heads is
$P(2\ heads) = 3(1/2 \times 1/2 \times 1/2) = 3/8$.
There are three ways in which you could get 1 head so the probability of getting one head is
$P(1\ head) = 3(1/2 \times 1/2 \times 1/2) = 3/8$.
There is one way in which you could get no heads. The probability of getting no heads is
$P(0\ head) = (1/2 \times 1/2 \times 1/2) = 1/8$.
Notice:
1. the numerators of $P(3)$, $P(2)$, $P(1)$ and $P(0)$ are the same as the 4th row of Pascal's triangle.
2. $P(3) + P(2) + P(1) + P(0) = 1$
There is one way in which you could get no heads so the probability of getting at least one head is $P(at\ least\ 1\ head) = 1 - (1/2 \times 1/2 \times 1/2) = 7/8$.
Conditional Probability
Conditional probability is the probability of event $A$ happening given that event $B$ has already happened. We write the probability like this $P(A|B)$ where the | should be read as 'given that'. $P(A|B)$ would read as the probability of $A$ happening given that $B$ has happened.
Imagine we have 100 people in a room. 10 are vegan, 30 are vegetarian and the rest eat meat. If we choose a person at random what is the probability that they are vegan?
$P($ vegan $)\ = 10/100 = 0.1$ or $10$%
What is the probability that they are vegan given that they don't eat meat?
$P($ vegan | don't eat meat$)\ = 10/40 = 0.25$ or $25$%
Q: The table shows the numbers of men and women that voted in the 2016 American presidential election. If you select a voter at random what is the most likely way they voted?
| Women | Men | |
| Clinton | 34.4 | 25.4 |
| Trump | 26.8 | 32.8 |
| Other | 2.5 | 3.7 |
A: Of the 125.6 million people that voted 59.8 million voted for Clinton and 59.5 million voted for Trump.
$P(Clinton)=59.8/125.6=0.476\ or\ 47.6\%$.
$P(Trump)=59.6/125.6=0.474\ or\ 47.5\%$.
so the most likely way they voted is for Clinton
Q: If your selection was male what is the most likely way they voted?
A: Of the 61.8 million men that voted 25.4 million voted for Clinton and 32.8 million voted for Trump.
$P(Clinton|male)=25.4/61.8=0.410\ or\ 41\%$.
$P(Trump|male)=32.8/61.8=0.530\ or\ 53\%$.
so the most likely way they voted is for Trump
Probability Distribution
Imagine you work for a company that makes shoes. You need to know how many of each size of shoe you should make. To do this you start by finding the mean and standard deviation of a representative sample of the population. You then map your shoe sizes on to the distribution.
If the mean UK male foot was UK size 10 with a standard deviation of 1 then a shoe of size 10 would fit 34% of the population. If you only made shoes of size 9 and 10 the shoes would fit 68% of the population.
Q: In 2022 the mean height of men in the UK was 1759 mm and the standard deviation was 74.2 mm. The UK population in 2022 was 67.6 million. If the standard door height was 1.9 m how many men would have to duck to go through a door?
| Range | $\bar{x}+s$ | $\bar{x}+2s$ | $\bar{x}+3s$ | |||
| Height | 1795 | 1833 | 1904 | |||
| Proportion | 34% | 14% | 2% |
A: 2% of the adult male population have to duck to go through a door. If 1/3 of the total population are adult males then the number who have to duck is
2% $\times$ 1/3 $\times$ 67.6 million which is about 450000 men.
Fortunately for most, but not all, of the tall men in the UK the standard door height is 1981 mm.